Sustainability
ESG data
Environmental Indicators
Direct and Indirect Greenhouse Gas Emissions
-
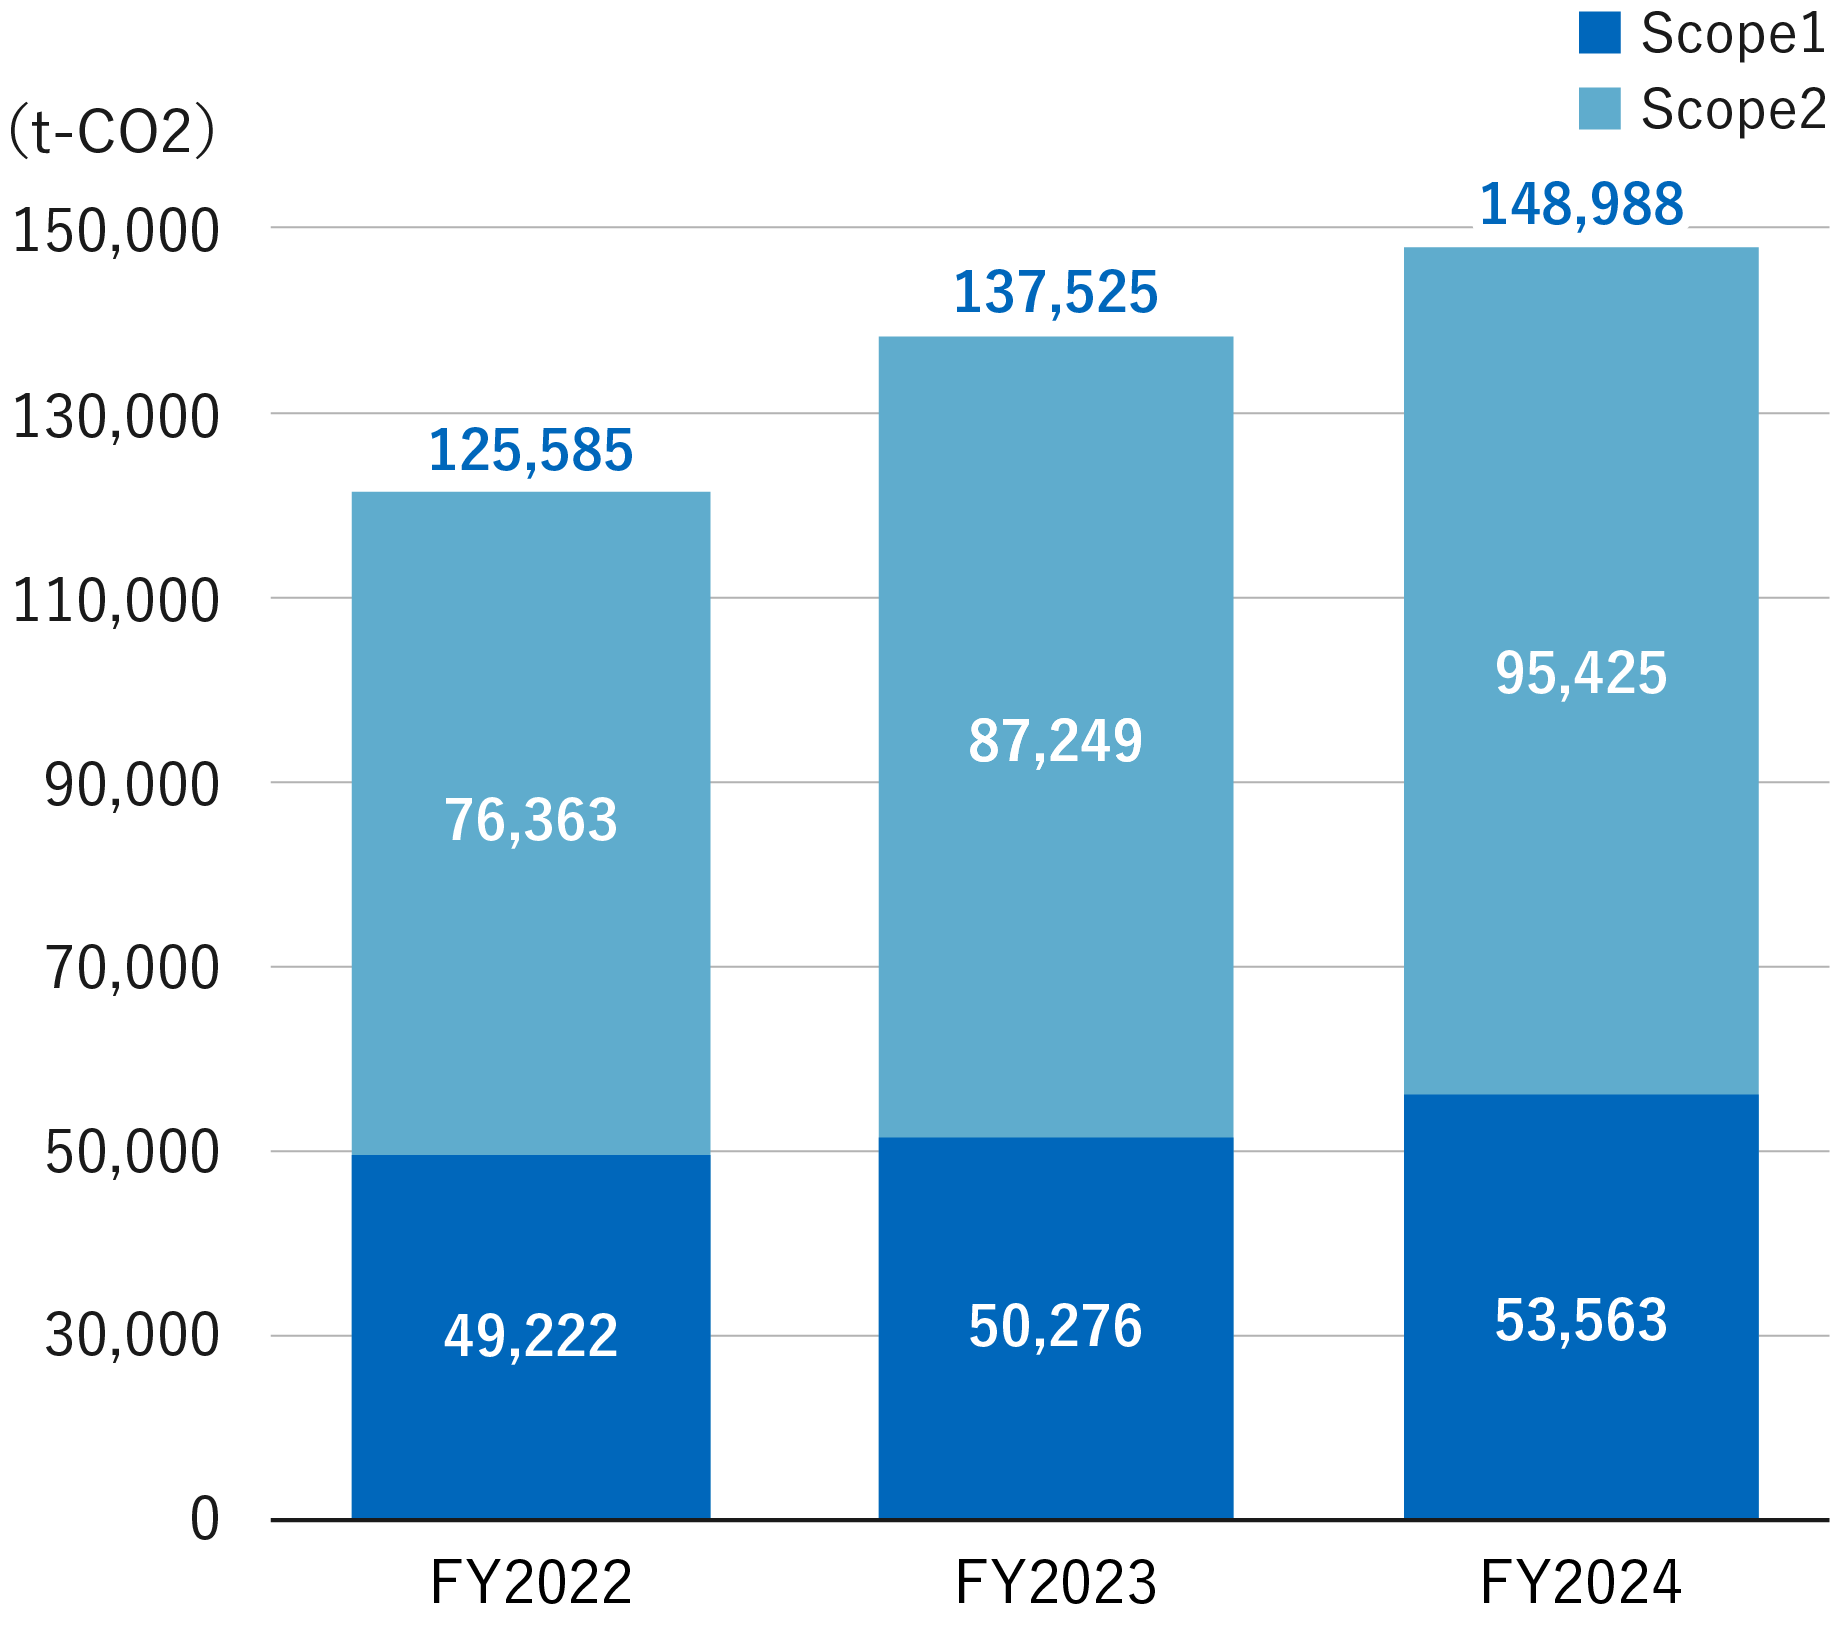
Kyoritsu Maintenance's Greenhouse Gas Emissions
- ※As of March 31, 2025
unit category FY2022 FY2023 FY2024 (t-CO2) total 125,585 137,525 148,988 Scope1 49,222 50,276 53,563 Scope2 76,363 87,249 95,425 -
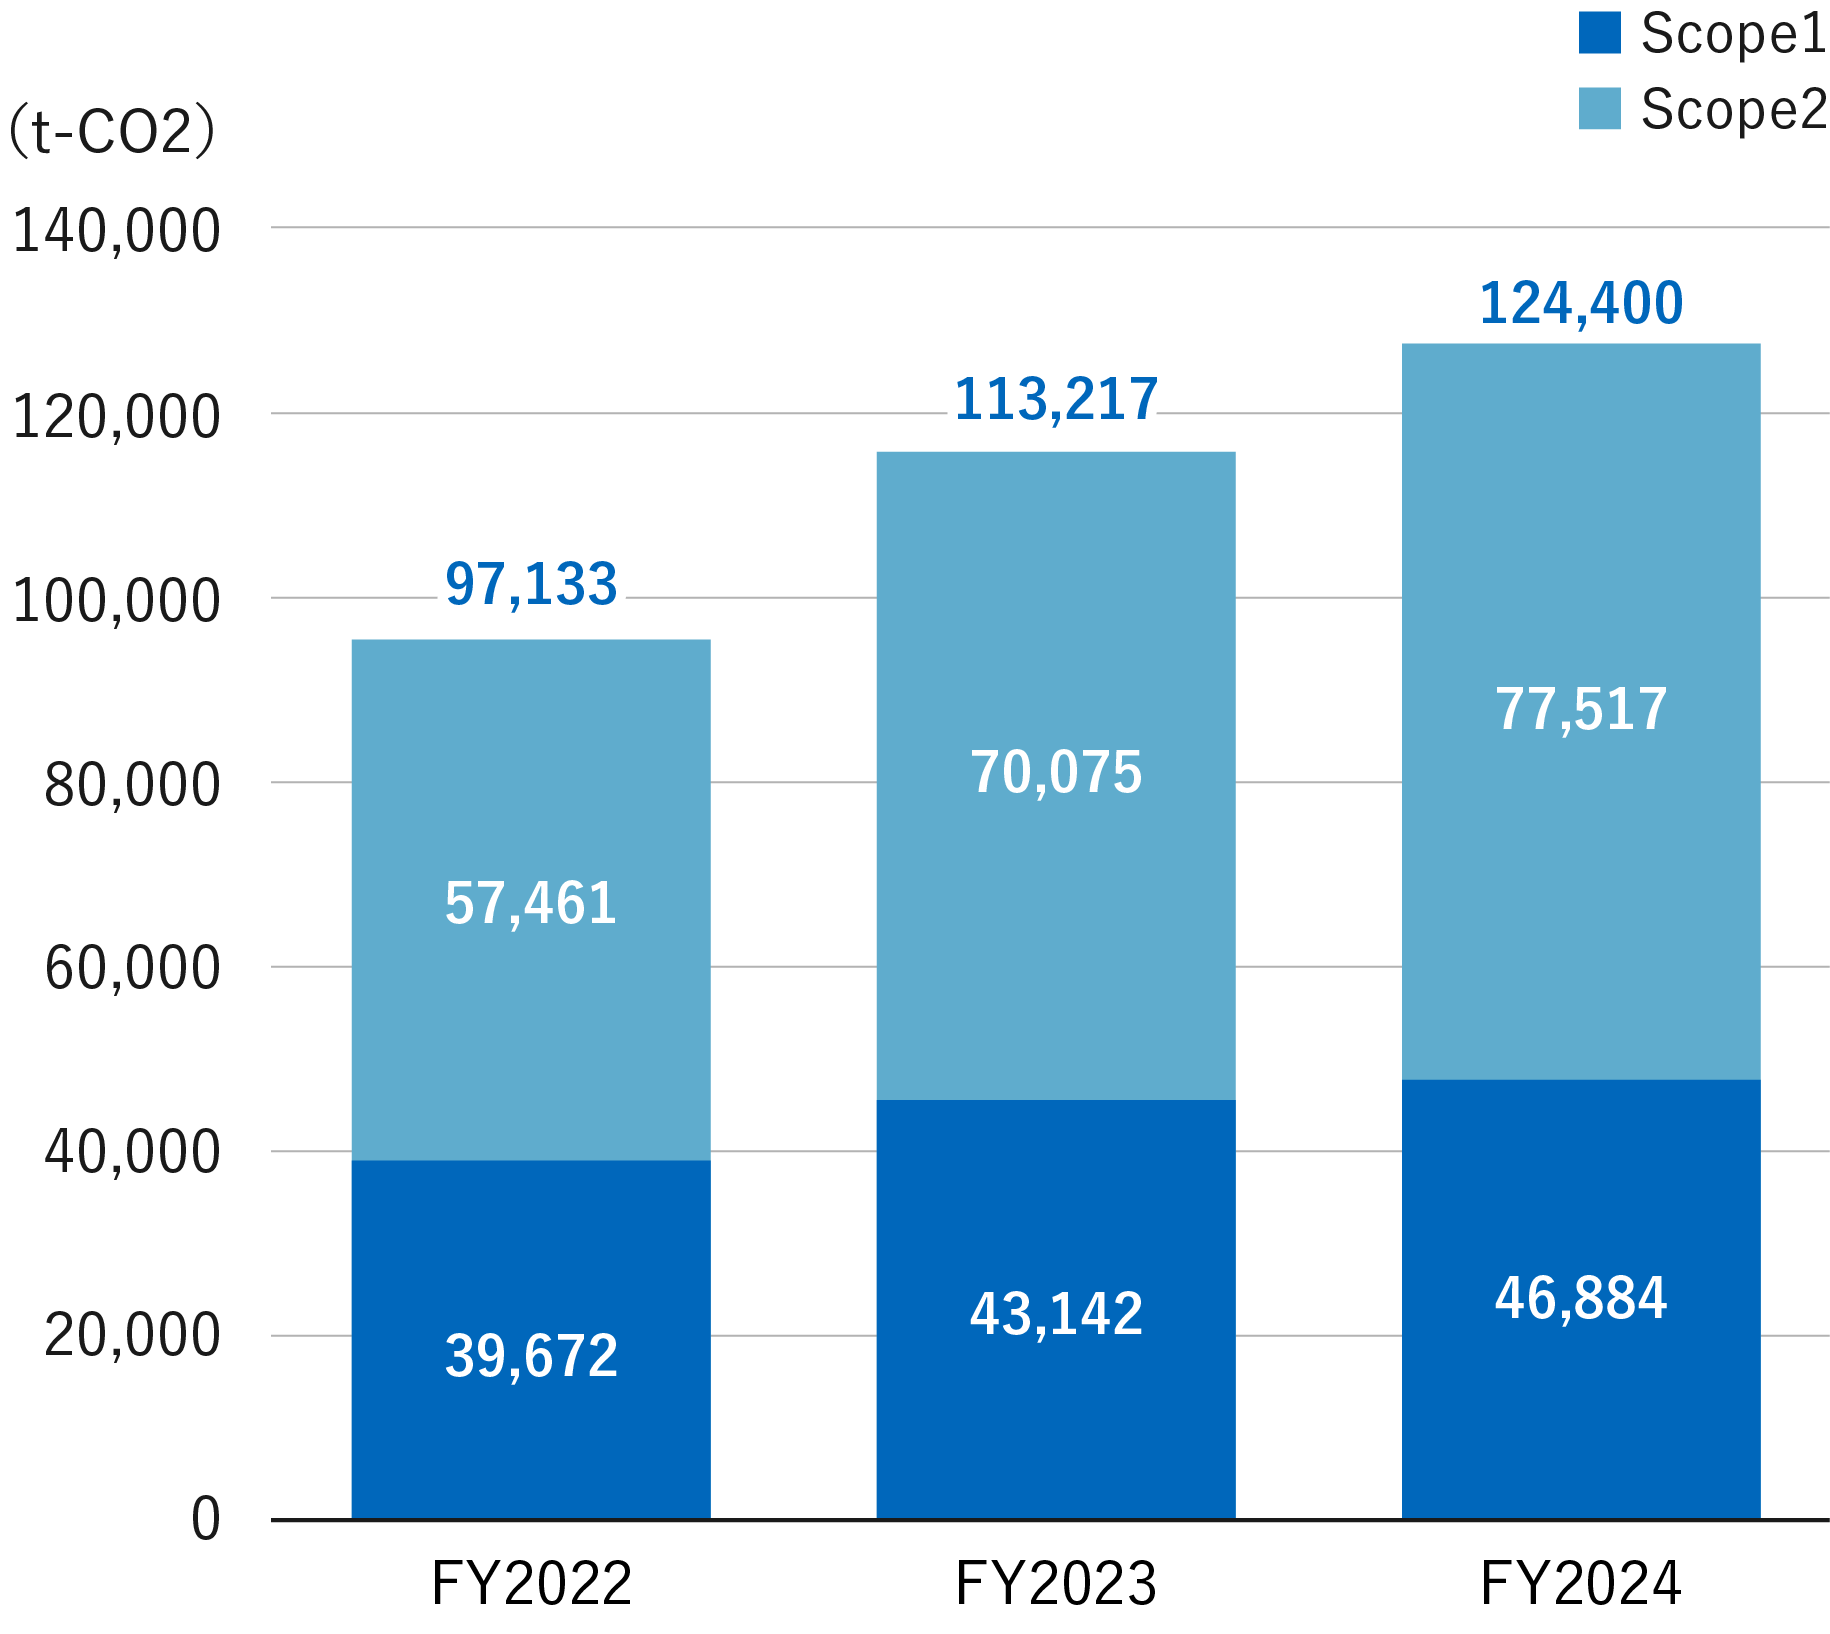
Greenhouse gas emissions from hotel operations
- ※As of March 31, 2025
unit category FY2022 FY2023 FY2024 (t-CO2) total 97,133 113,217 124,400 Scope1 39,672 43,142 46,884 Scope2 57,461 70,075 77,517
In FY2024, Kyoritsu Maintenance's greenhouse gas emissions were 148,988 t-CO2 (up 8.3% year-on-year).
In addition, greenhouse gas emissions from hotel operations in FY2024 were 124,400 t-CO2 (up 9.9% year-on-year). The increase is mainly due to the newly developed business sites and the increase in the occupancy rate and the number of hotel guests. The occupancy rate and the number of hotel guests in FY2024 are 85.2% (up 0.3 points from the same period last year) and 9,885,000 (up 5.4% from the same period last year), respectively. A certain degree of reduction in greenhouse gas emissions was observed at existing business facilities as a result of planned renovation work and replacement of facilities and equipment with high-efficiency equipment that is more energy-efficient. However, overall GHG emissions are on an increasing trend.
Water usage
-
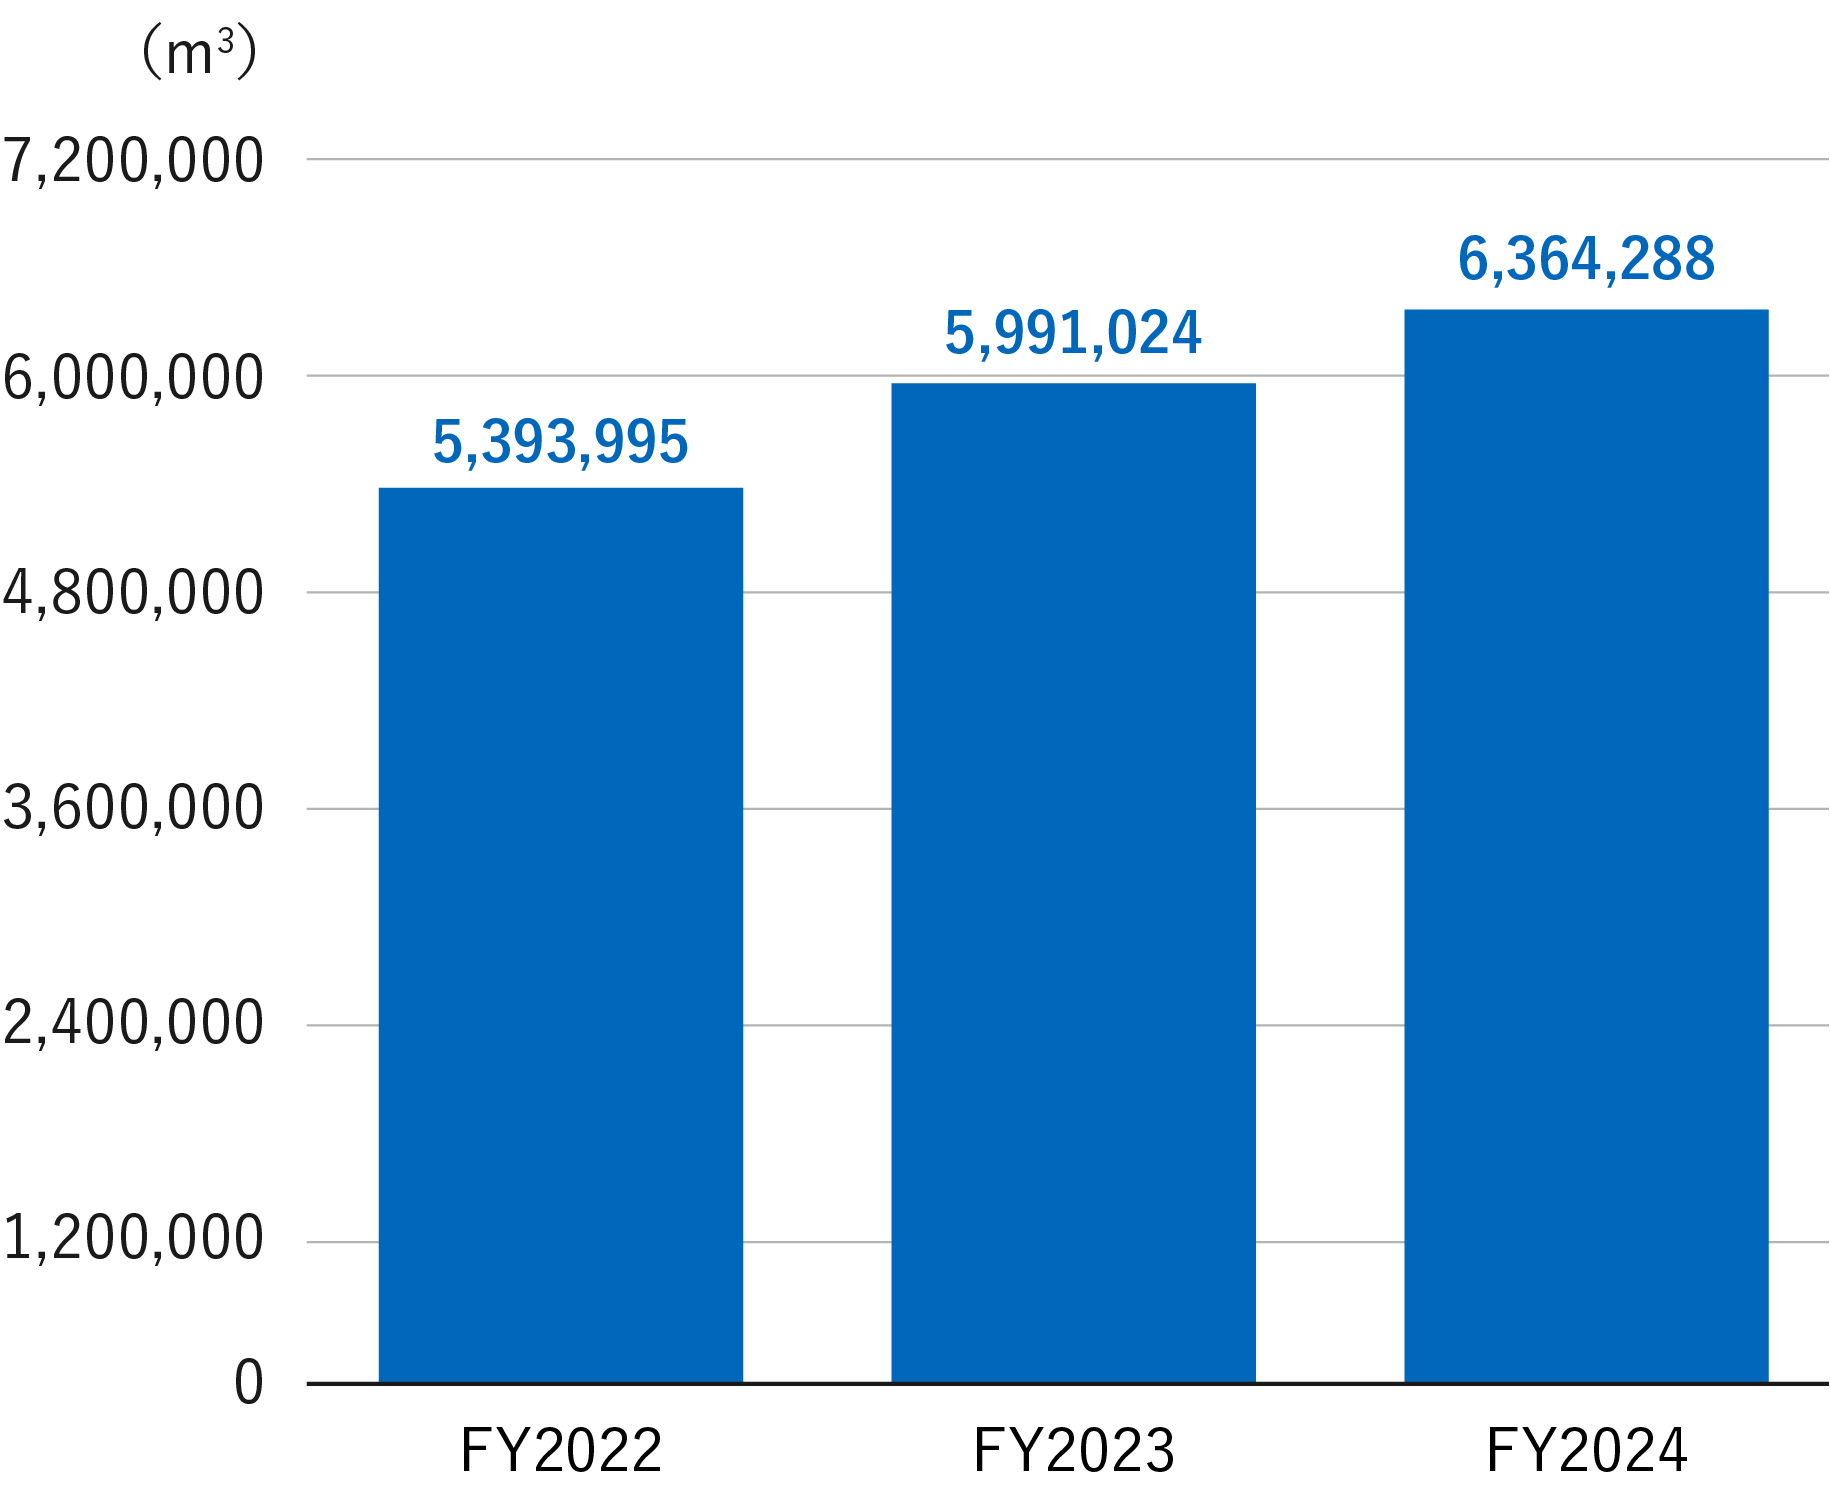
Kyoritsu Maintenance's water usage
- ※As of March 31, 2025
unit FY2022 FY2023 FY2024 (㎥) 5,393,995 5,991,024 6,364,288 -
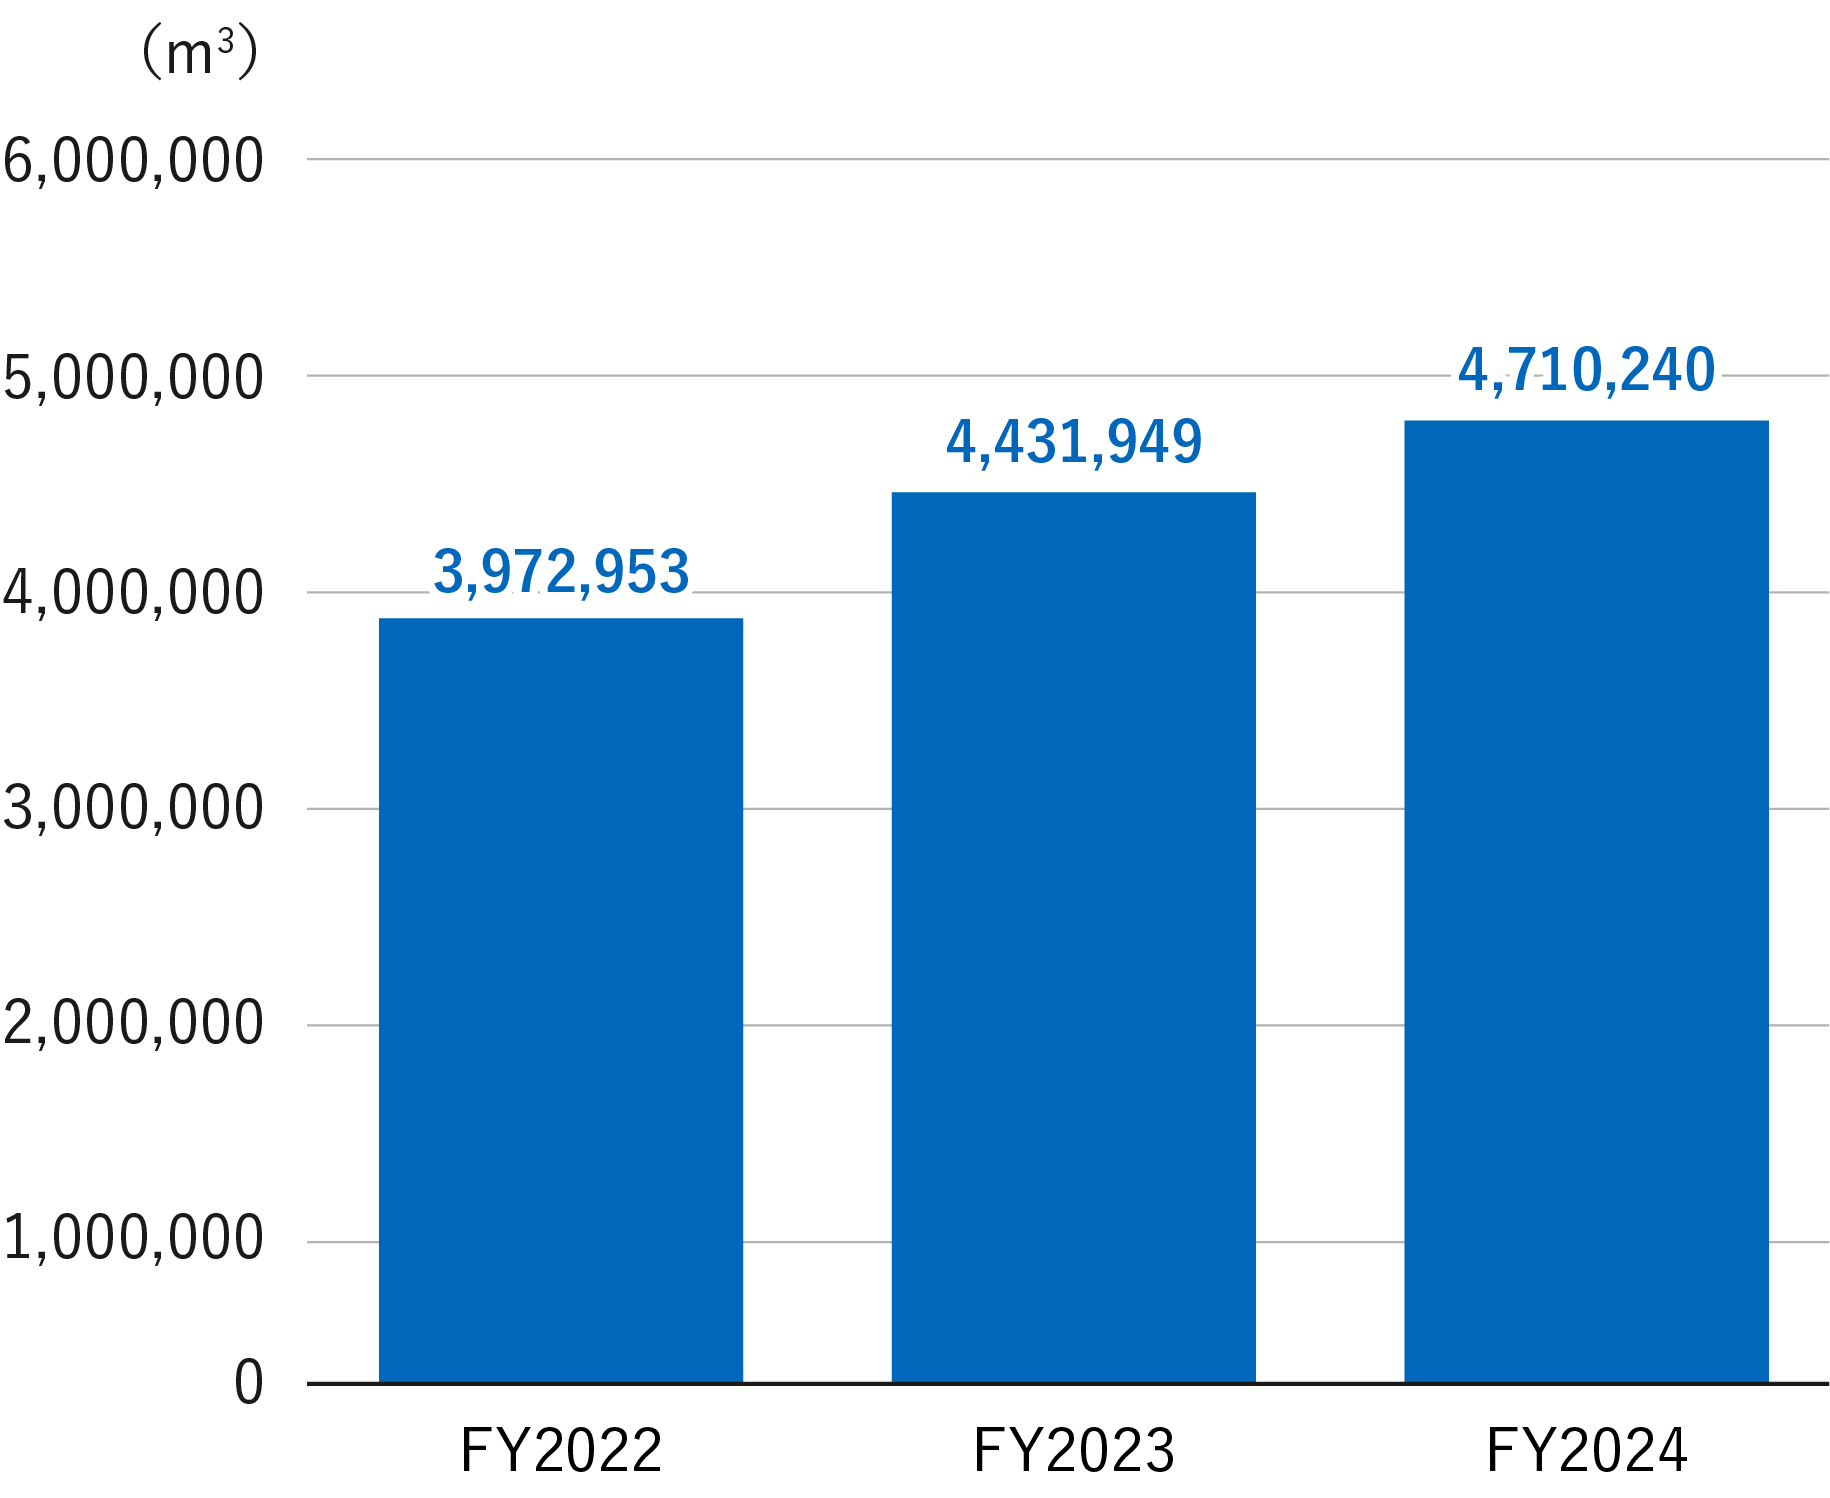
Water consumption of hotel projects
- ※As of March 31, 2025
unit FY2022 FY2023 FY2024 (㎥) 3,972,953 4,431,949 4,710,240
In FY2024, Kyoritsu Maintenance's water consumption was 6,364,288 m3 (up 6.2% from the same period of the previous year). In addition, water consumption in the hotel business in FY2024 was 4,710,240 m3 (up 6.3% y-o-y), with water consumption in the hotel business accounting for 74.0% of Kyoritsu Maintenance's total water consumption. This increase was mainly due to an increase in the occupancy rate and number of nights in the hotel business.
Social Indicators
-
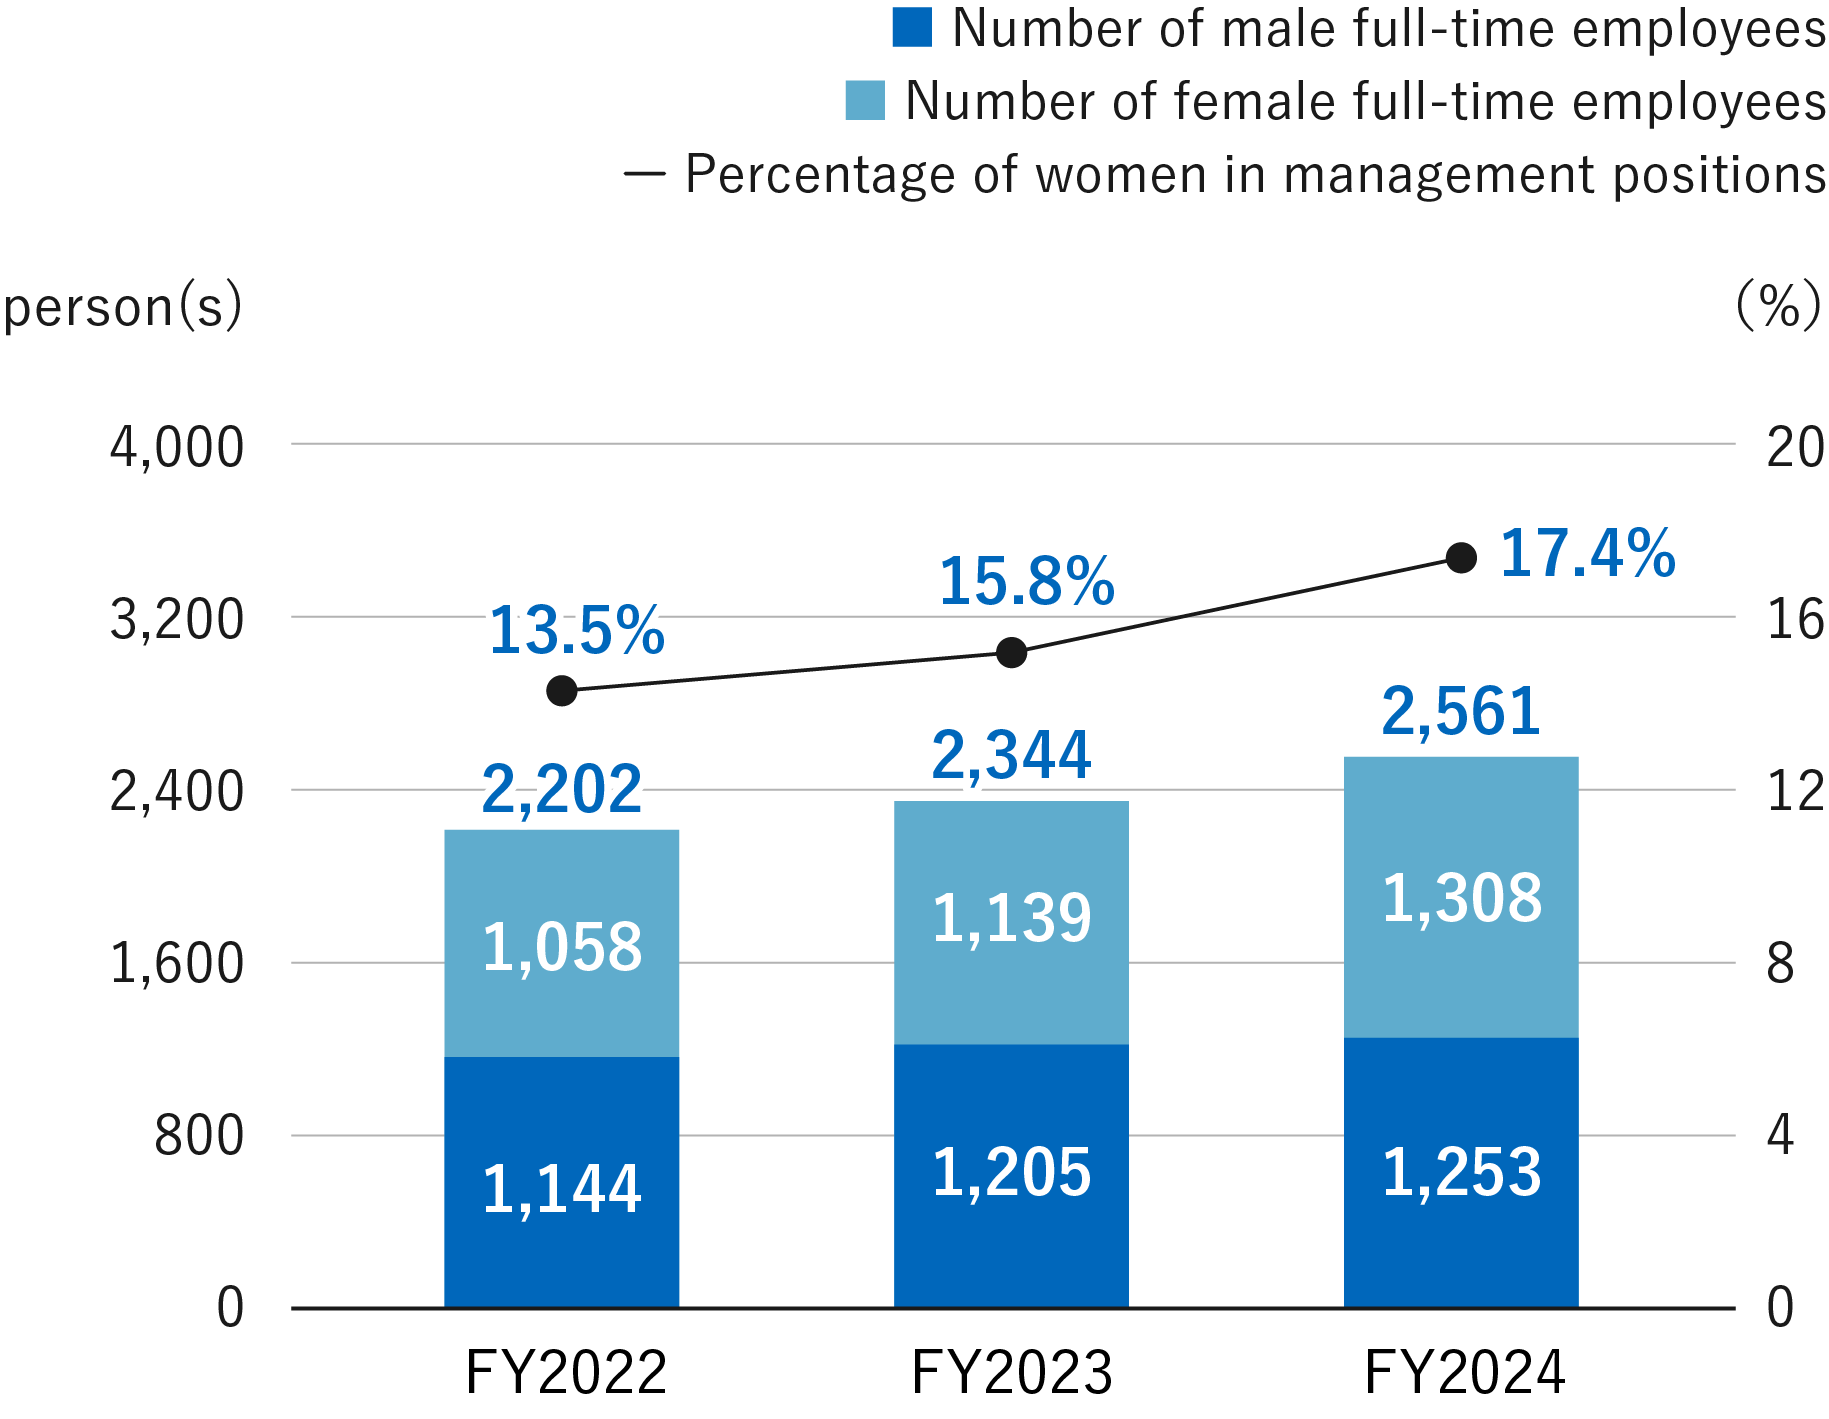
Composition of Full-Time Employees by Gender and Ratio of Female Managers
-
- ※As of March 31, 2025
- ※Kyoritsu Maintenance Co., Ltd.
unit category FY2022 FY2023 FY2024 person(s) total 2,202 2,344 2,561 Number of male full-time employees 1,144 1,205 1,253 Number of female full-time employees 1,058 1,139 1,308 (%) Percentage of women in management positions 13.5% 15.8% 17.4% As of the end of March 2025, full-time employees consisted of 48.9% men and 51.1% women. The company aims to have women occupy 20% of managerial positions by the end of March 2028. As of March 2025, the percentage of female managers stood at 17.4%, an increase of 1.6 percentage points from the previous year.
-
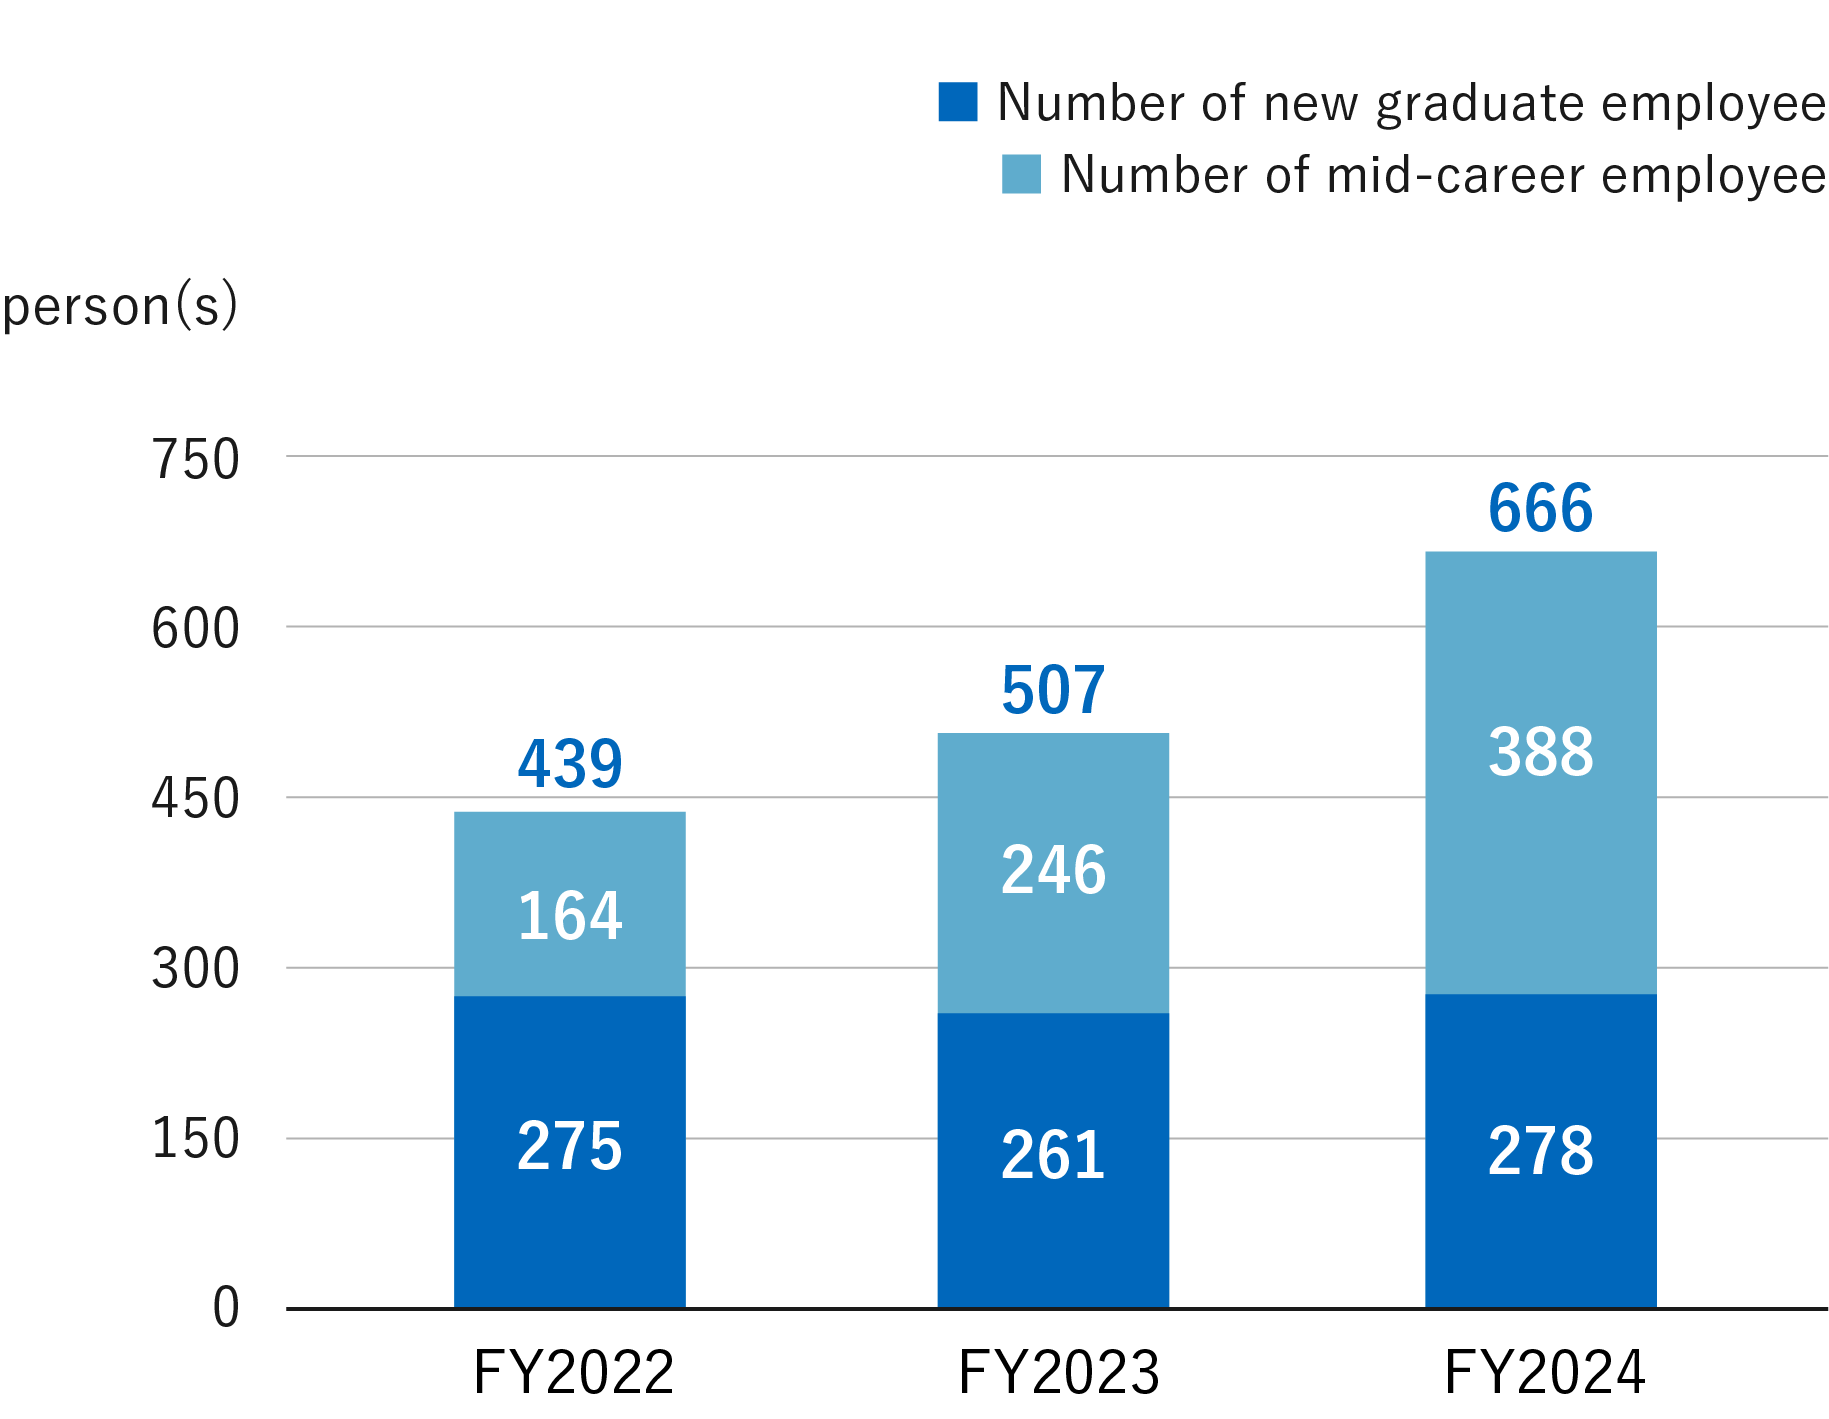
Number of Full-Time Employees
-
- ※As of March 31, 2025
- ※Kyoritsu Maintenance Co., Ltd.
unit category FY2022 FY2023 FY2024 person(s) total 439 507 666 Number of new graduate employee 275 261 278 Number of mid-career employee 164 246 388 As of the end of March 2025, the company had 666 full-time employees, comprising 278 new graduates (41.7%) and 388 mid-career hires (58.3%). We believe that fostering diversity is essential for sustainable growth. Accordingly, we actively recruit talented individuals—regardless of gender or nationality—both among new graduates and mid-career professionals, and we promote capable employees to management positions.
-
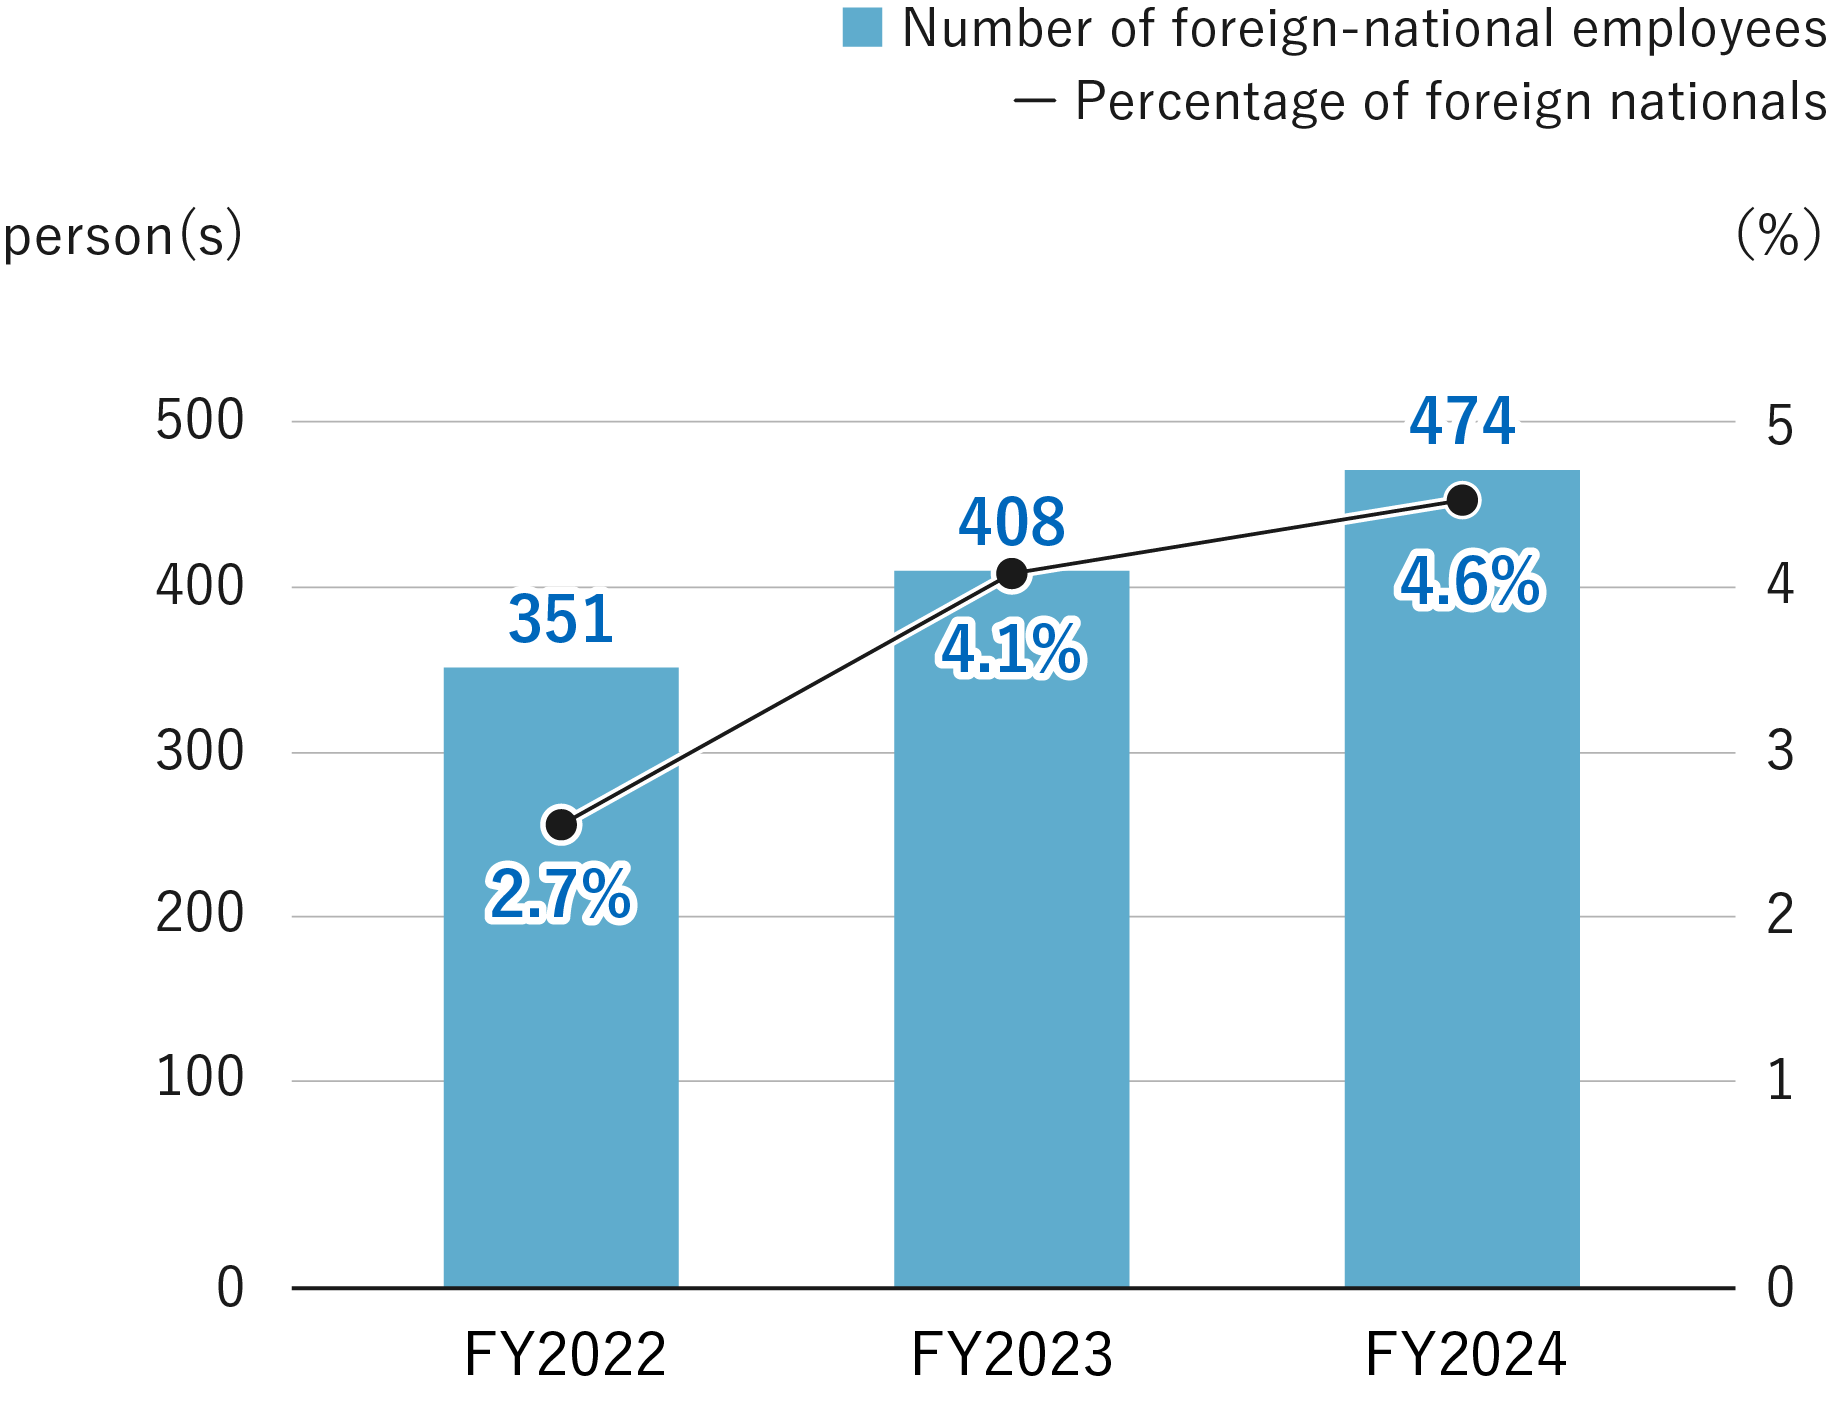
Percentage of foreign nationals
-
- ※As of March 31, 2025
- ※Kyoritsu Maintenance Co., Ltd.
unit category FY2022 FY2023 FY2024 person(s) Number of foreign-national employees 351 408 474 (%) Percentage of foreign nationals 2.7% 4.1% 4.6% As of the end of March 2025, the number of foreign employees stood at 474, an increase of 66 from the previous year, accounting for 4.6% of the total workforce, an increase of 0.5 percentage points from the previous year. Our company is committed to building an organization that embraces diverse values, and we have established various support systems to help employees stay motivated, regardless of their race or cultural background. Although the ratio of foreign employees declined during the FY2020 due to the impact of the COVID-19 pandemic, it had recovered by end of March 2025.
-
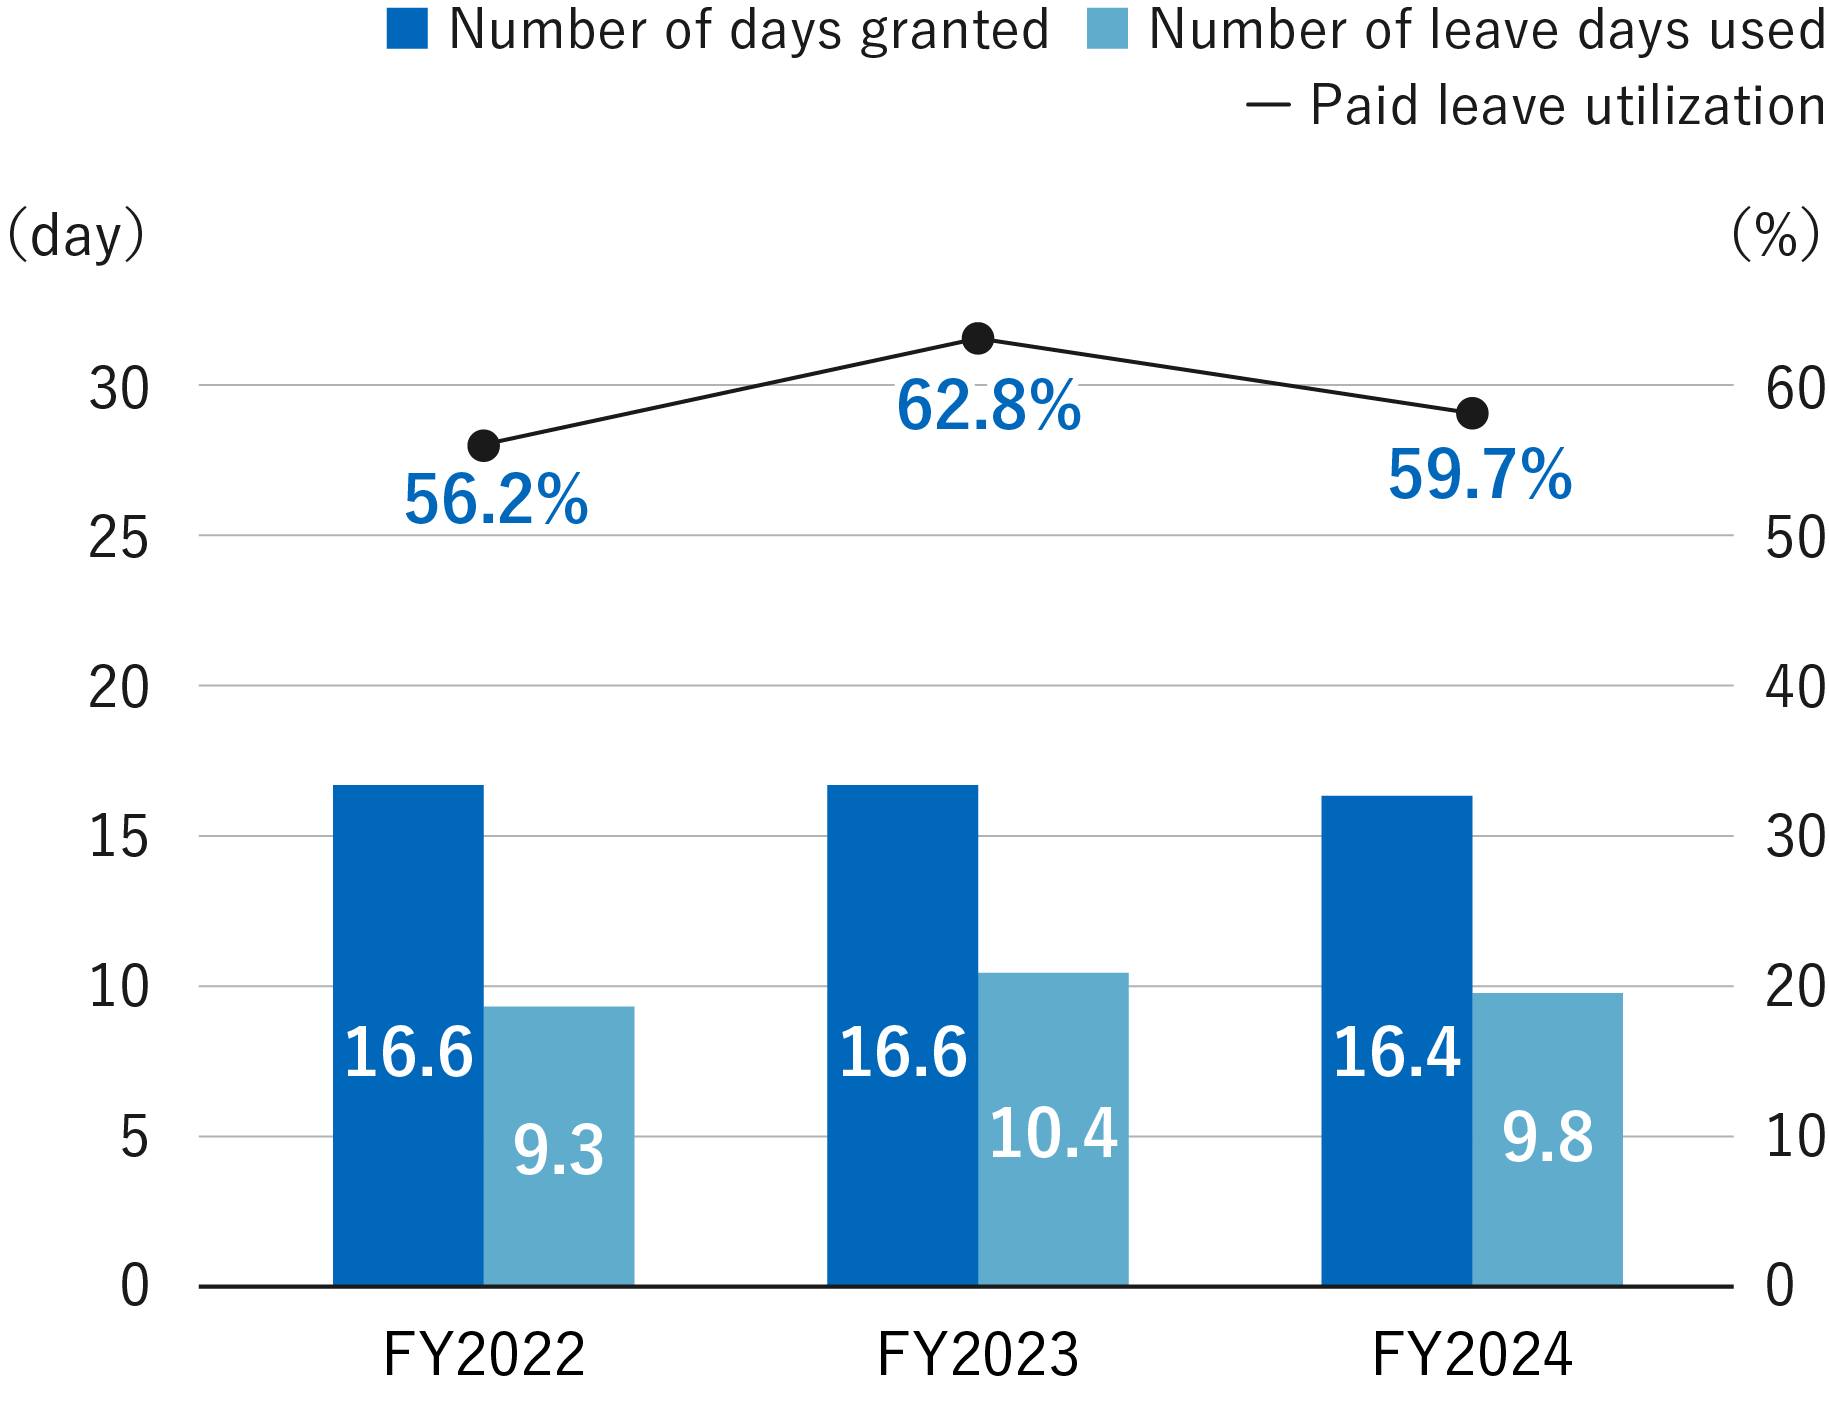
Paid leave utilization
-
- ※As of March 31, 2025
- ※Kyoritsu Maintenance Co., Ltd.
unit category FY2022 FY2023 FY2024 day(s) Number of days granted 16.6 16.6 16.4 Number of leave days used 9.3 10.4 9.8 (%) Paid leave utilization 56.2% 62.8% 59.7% As of March 31, 2025, the paid leave utilization rate stood at 59.7%, a 3.1 percentage point decrease from the previous year.
-
Childcare leave take-up rate
-
- ※As of March 31, 2025
- ※Kyoritsu Maintenance Co., Ltd.
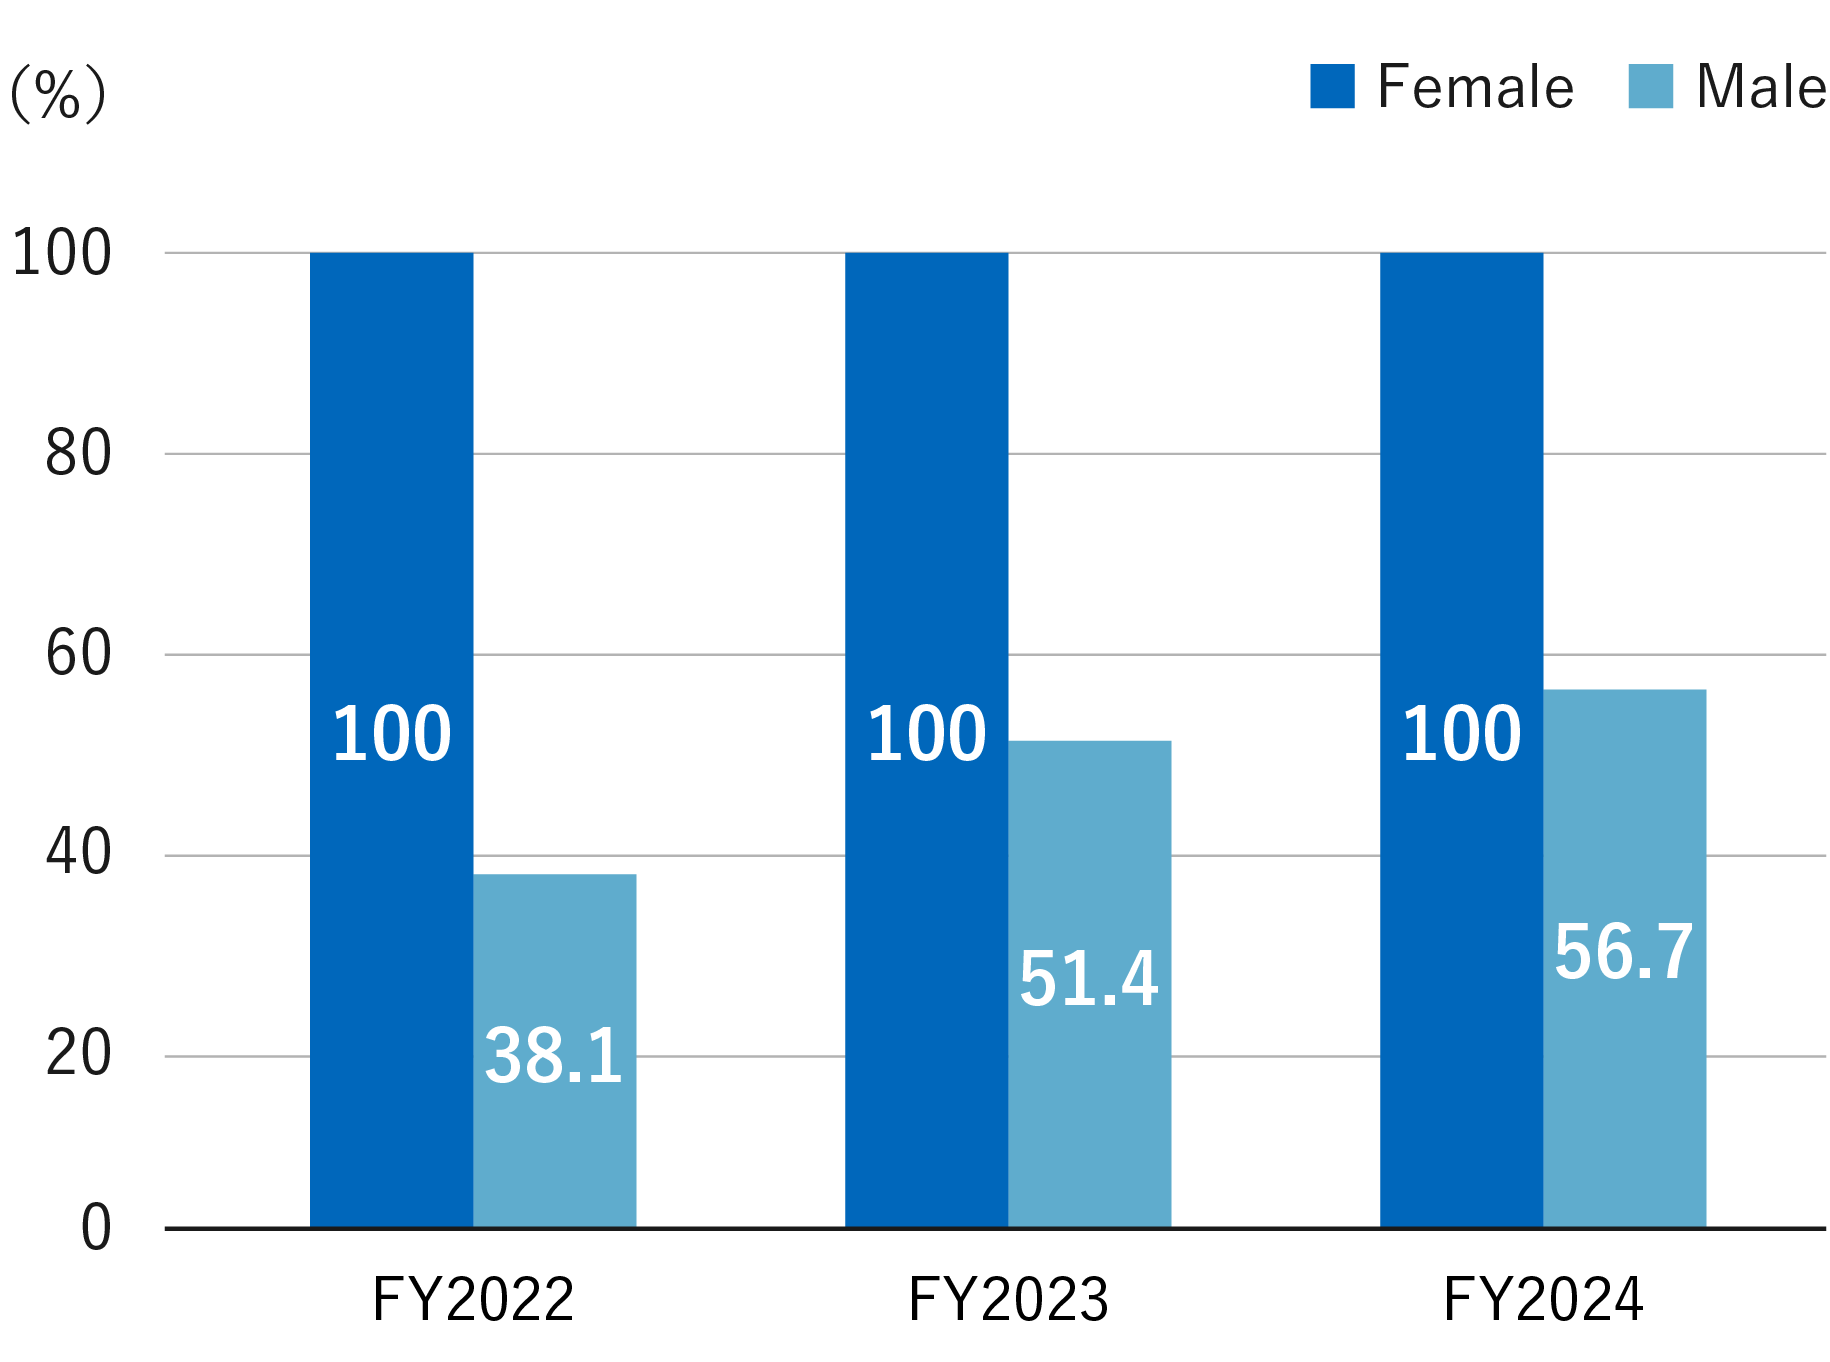
unit category FY2022 FY2023 FY2024 (%) Female 100% 100% 100% Male 38.1% 51.4% 56.7% As of the end of March 2025, 56.7% of men took childcare leave, an increase of 5.3 percentage points from the previous year, while 100% of women took childcare leave, unchanged from the prior year. Our company is committed to fostering a culture where both men and women can take childcare leave without discrimination, and the number of male employees taking childcare leave—including those at business sites—has been steadily increasing each year.
-
Average years of service
-
- ※As of March 31, 2025
- ※Kyoritsu Maintenance Co., Ltd.
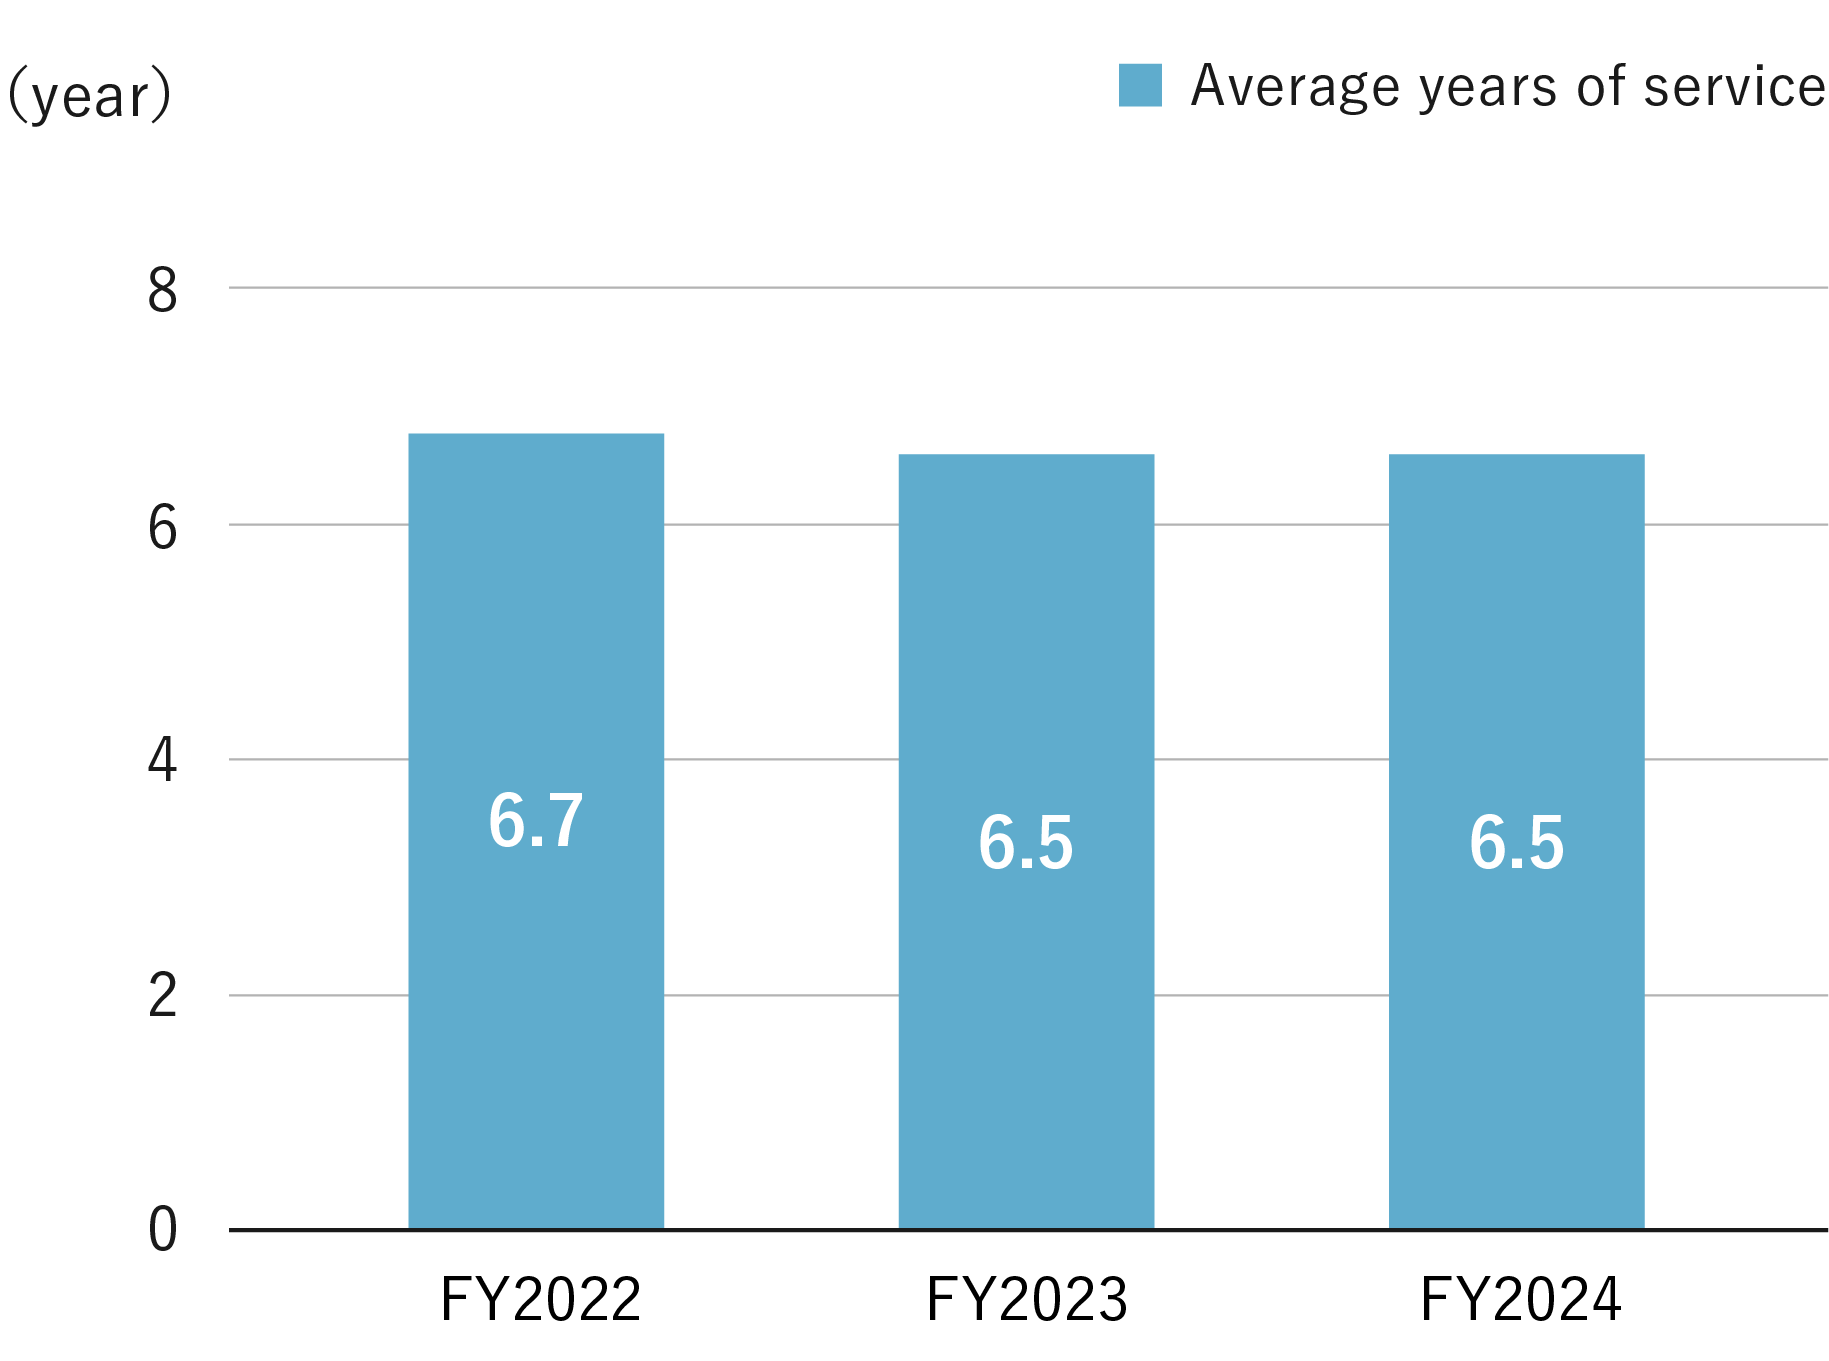
unit category FY2022 FY2023 FY2024 year(s) Average years of service 6.7 6.5 6.5 As of the end of March 2025, the average length of service was 6.5 years, unchanged from the previous year.
Governance Indicators
-
Pecentage of Independent Outside Directors on the Board of Directors
-
- ※As of March 31, 2025
- ※Kyoritsu Maintenance Co., Ltd.
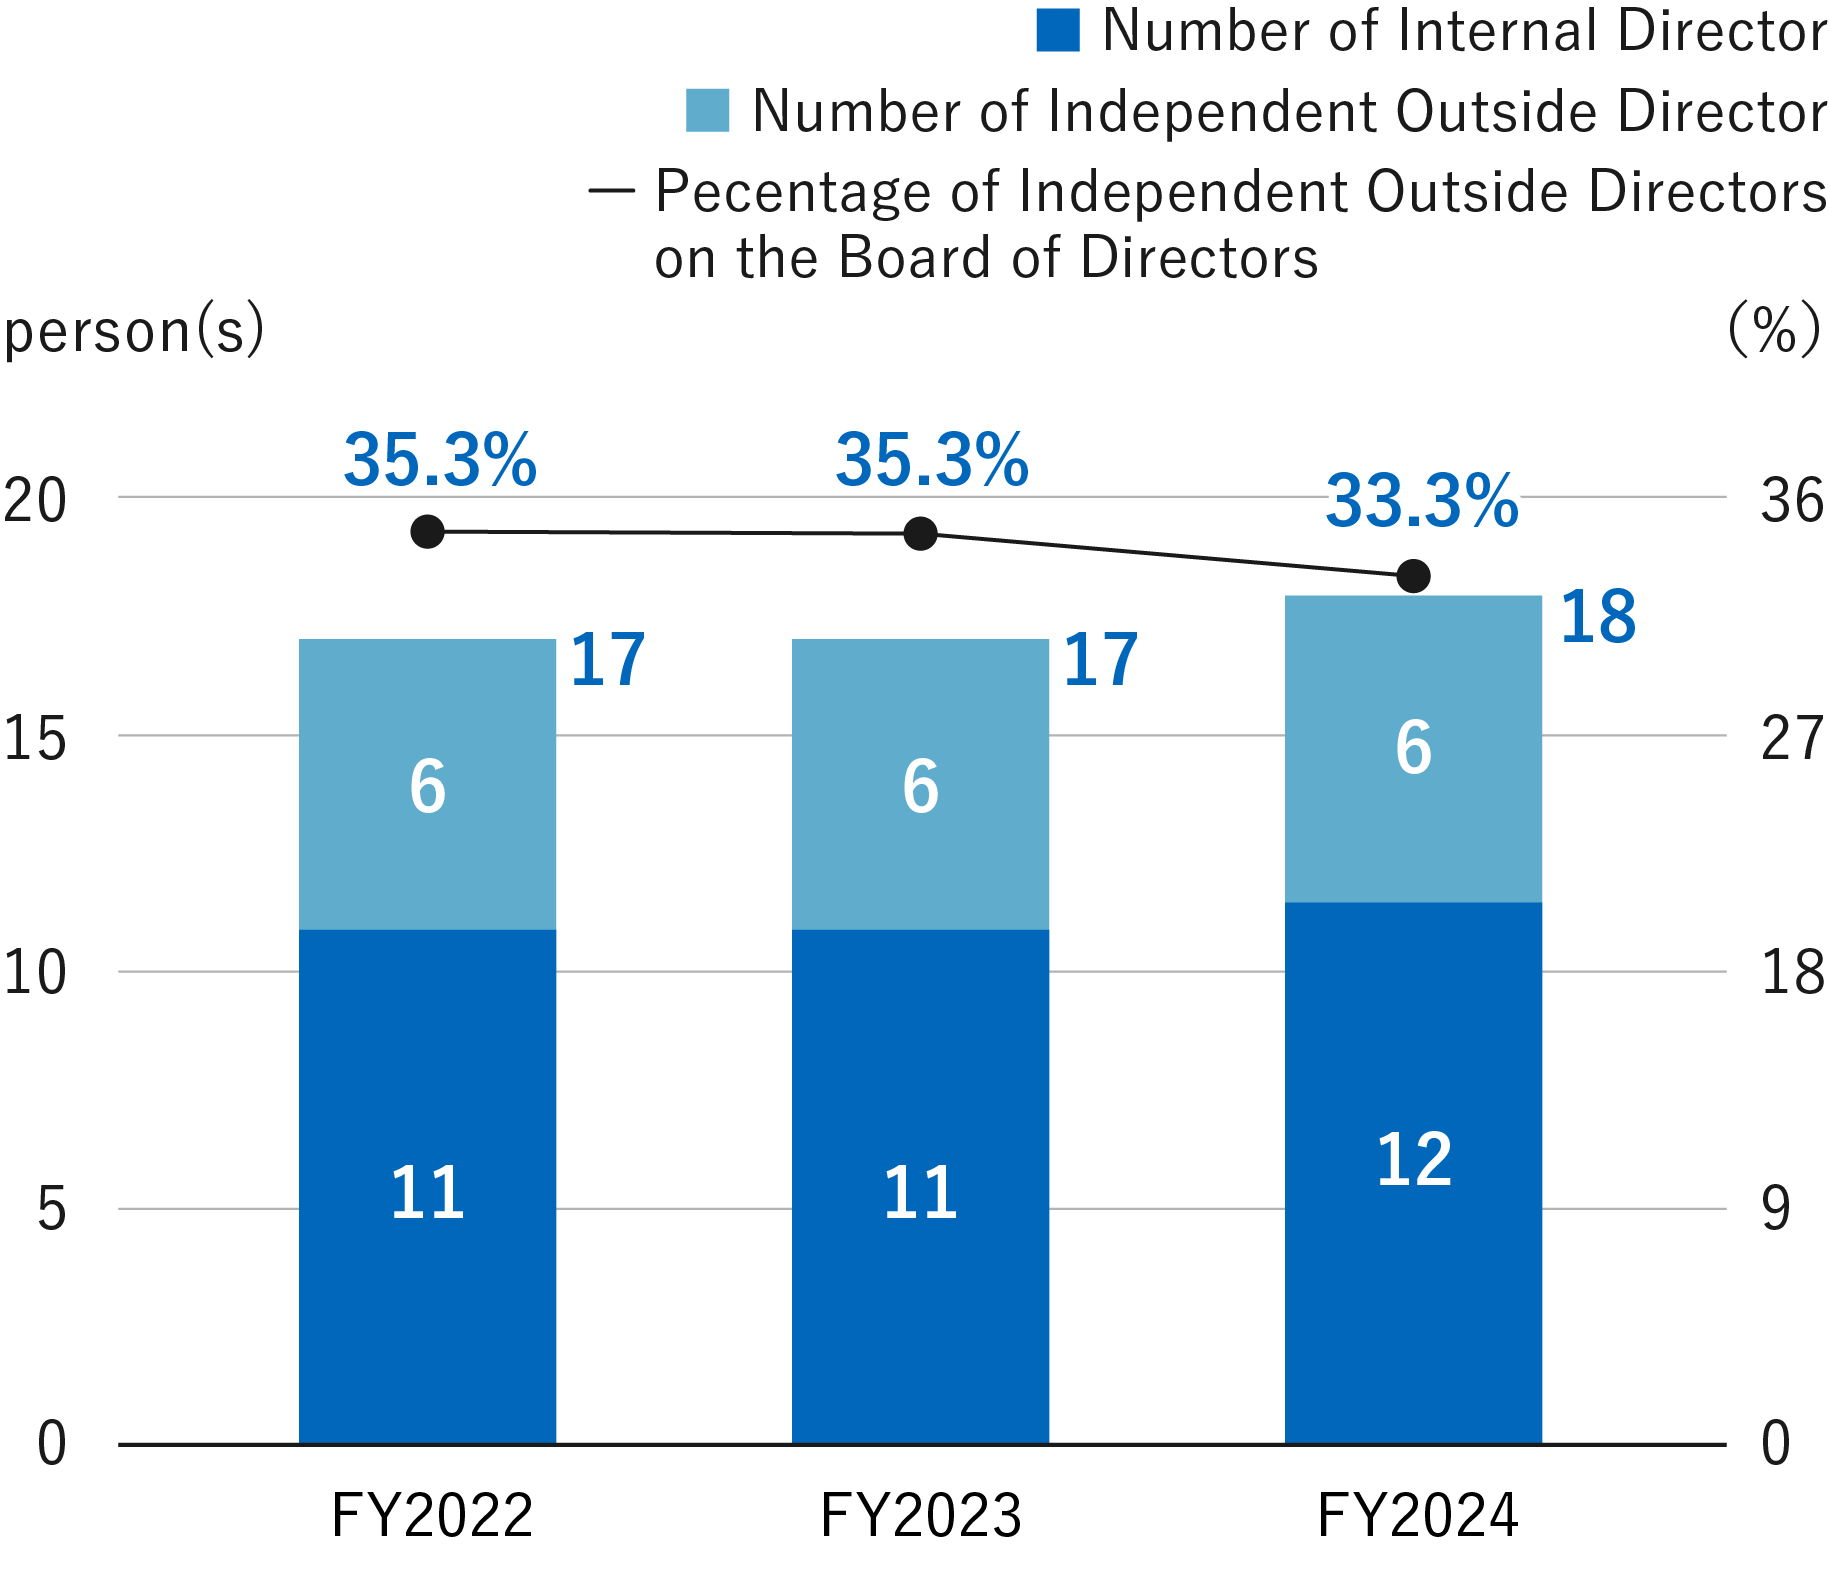
unit category FY2022 FY2023 FY2024 person(s) total 17 17 18 Number of Internal Director 11 11 12 Number of Independent Outside Director 6 6 6 (%) Pecentage of Independent Outside Directors on the Board of Directors 35.3% 35.3% 33.3% As of the end of March 2025, independent outside directors made up 33.3% of the board, a 2.0 percentage points decrease from the previous year. They are selected for their specialized expertise across diverse fields, along with their extensive experience and insights, and are expected to offer proactive advice during board meetings and other occasions.
-
Percentage of Women on the Board of Directors
-
- ※As of March 31, 2025
- ※Kyoritsu Maintenance Co., Ltd.
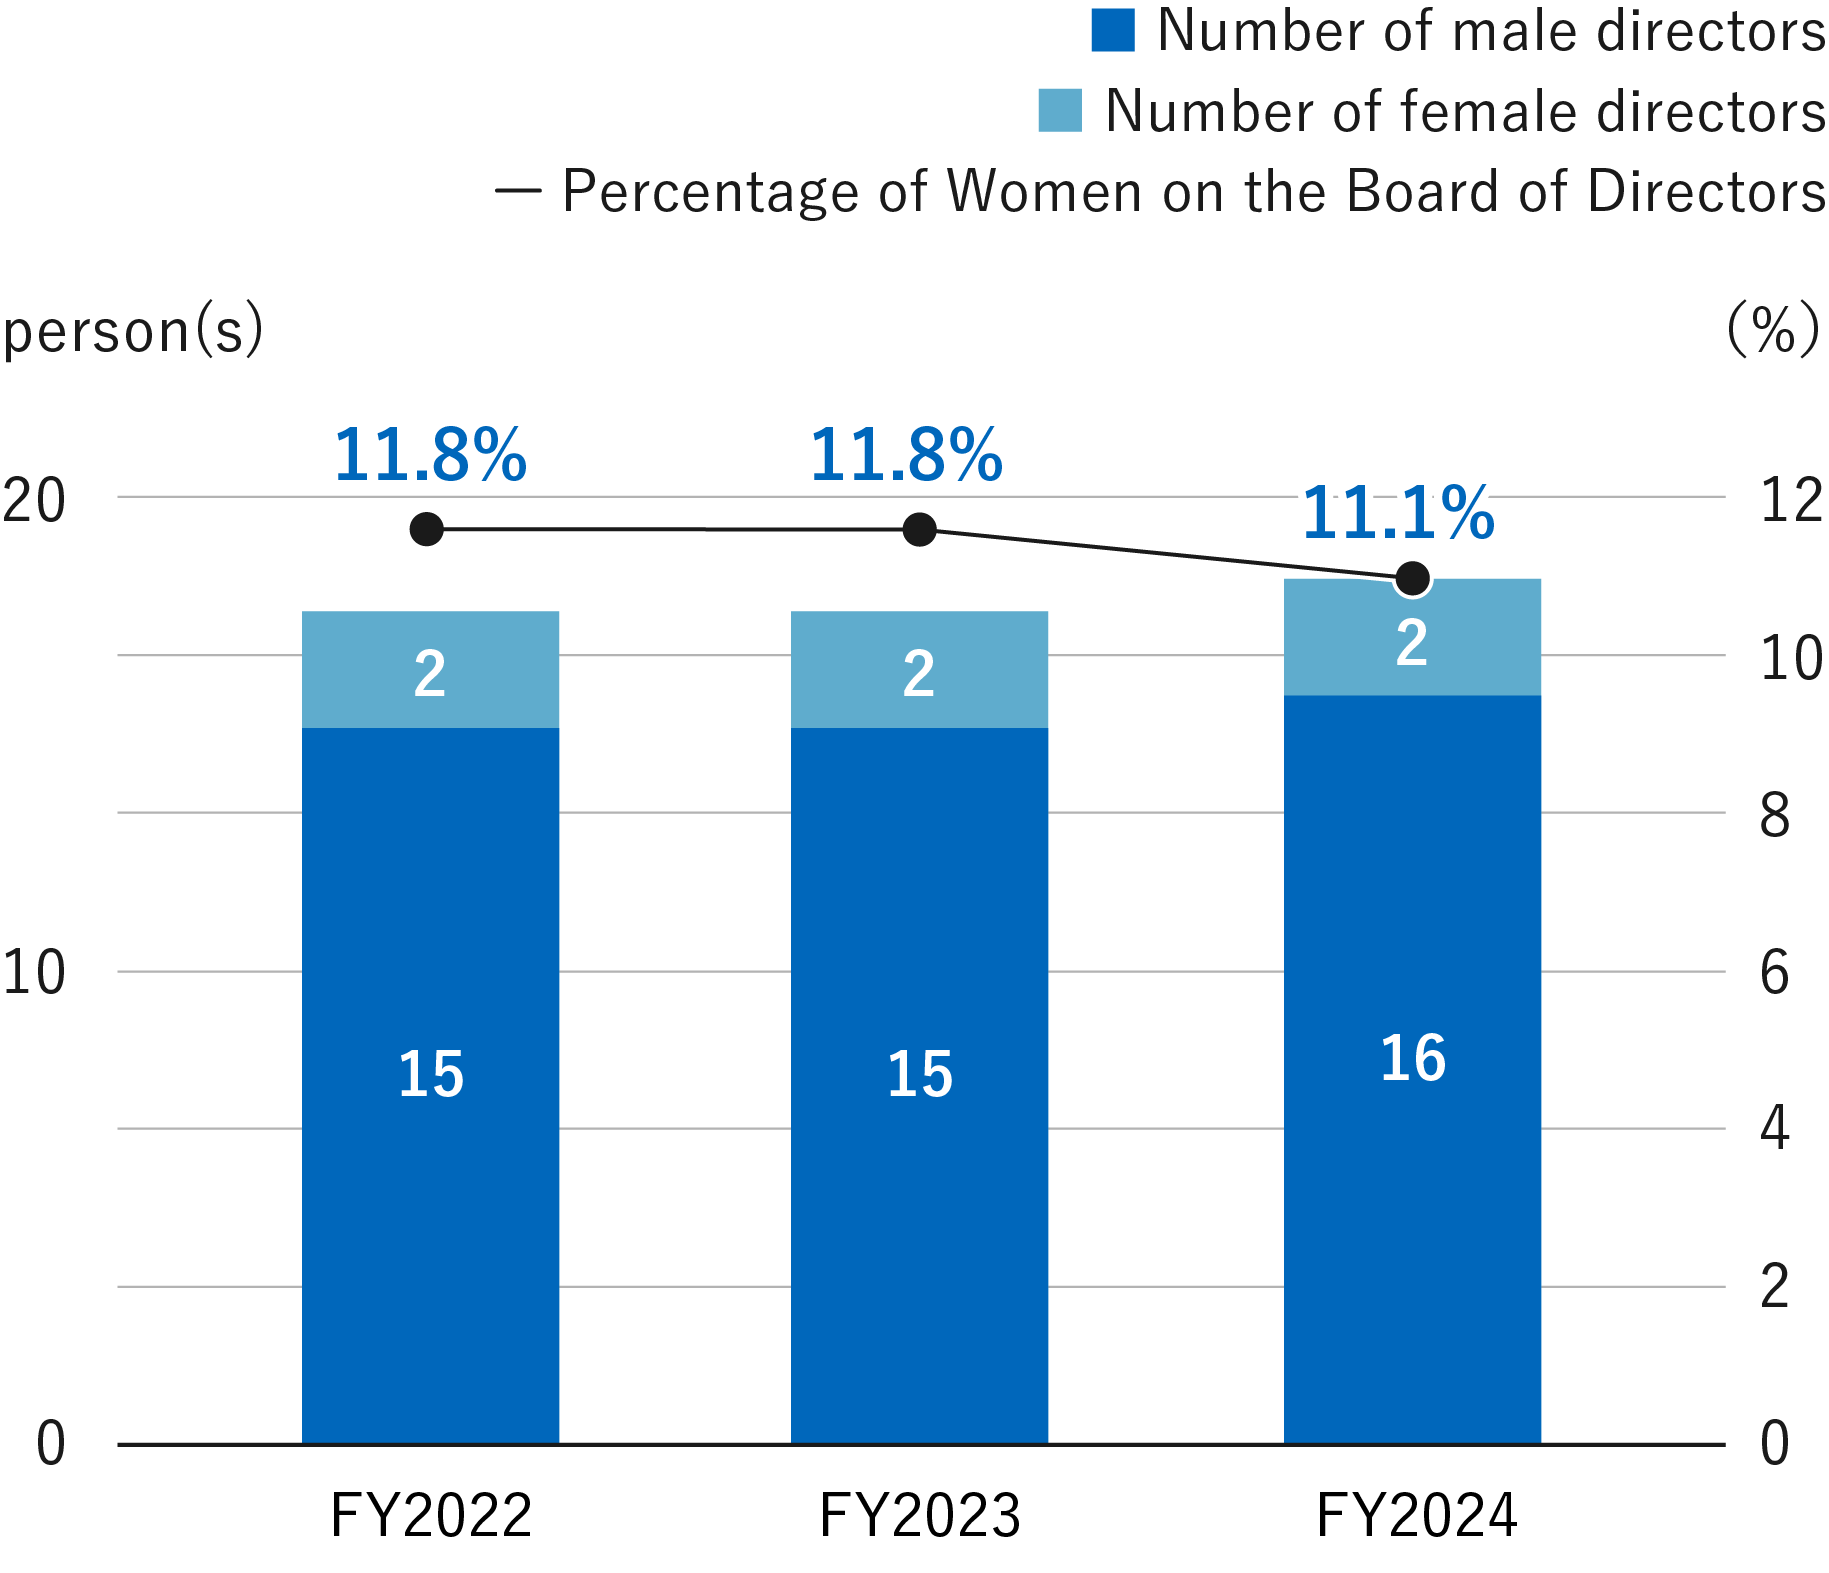
unit category FY2022 FY2023 FY2024 person(s) Number of male directors 15 15 16 Number of female directors 2 2 2 (%) Percentage of Women on the Board of Directors 11.8% 11.8% 11.1% As of the end of March 2025, women accounted for 11.1% of the board of directors, a 0.7 percentage point decrease from the previous year. Our company values diversity and appoints directors based on their extensive knowledge and experience in corporate management and finance, regardless of nationality, race, gender, work history, or age.
